Fast vLLM: cutting cold starts by 20x
Reducing container start-up time from 117s to 6s, the long way round.
I am not a patient person. I would like to usher in the open-weights revolution as much as the next person, but I can’t bear to wait two minutes to spin up a measly 3B parameter model just to address a passing thought. Nor can inference providers afford to waste seconds, let alone minutes, waiting for their autoscaler to spin up new instances when demand runs hot – time is money, as they say. vLLM may be very good at squeezing throughput out of a GPU – but inference optimisation requires a full-stack approach; it’s no good serving hundreds of tokens per second if it takes us several minutes to get there – by which point, my fleeting curiosity has dwindled – we want answers, and we want them now.
Cold-start latency goes beyond a minor annoyance into a serious tax on revenue. The good news is that it is entirely addressable: most of it is work that we’ve already done, and, in principle, could avoid doing again. This post documents an attempt to do exactly that, while taking the scenic route.
Much of this work was inspired and directly guided by the excellent Cloudburst write-up from Doubleword. All metrics reported throughout this post reference Llama-3.2-3B-Instruct. Cold starts assume a freshly launched container with a cold page cache.
Starting vLLM #
Let’s hit the ground running with an exposition of what happens when you execute vllm serve.
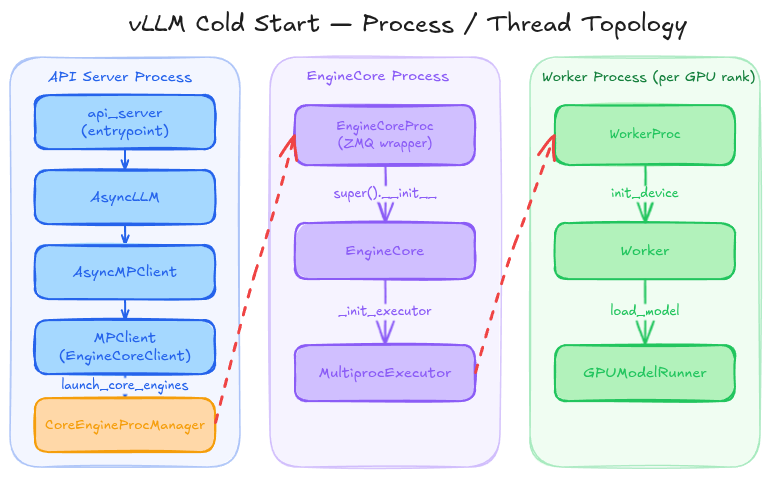
On startup, the process hits an entrypoint which begins to initialise vLLM. The main process is the API server, which launches the engine in a background process. On initialisation, the engine core loads a model executor which in turn begins to initialise workers across all of the ranks. Then, the worker constructs the model runner.
The model runner uses a loader to build the model architecture from config directly on-device, and has tensors allocated in GPU memory ready to receive parameters. The loader then populates these addresses by passing a weight iterator, which wraps the safetensors pre-downloaded from Huggingface, to the loaded model’s weight loader. The loader iterates over each tuple (name, loaded_weight) in the iterator, copying each parameter into its destination address. Ultimately, in the simplest case (ignoring book-keeping), weight loading amounts to:
for name, loaded_weight in weight_iterator:
  param.data.copy_(loaded_weight)
This performs a PyTorch in-place copy, which under the hood dispatches to cudaMemcpyAsync – per-tensor – and then waits on cudaStreamSynchronize (blocking). Worse, the parameters are present in pageable memory, and so must first be staged in a pinned buffer before being transferred to GPU. Each individual copy_ incurs:
- CUDA API call overhead per tensor,
- a copy into a pinned buffer on host before DMA to device,
- no opportunity for CUDA runtime to coalesce the transfers (sad for PCIe),
- and the CPU blocks on each transfer before the Python loop is able to advance to the next tensor.
This should be setting off alarm bells for any self-respecting inference engineer – we’re left with hundreds of small transfers with overhead between each. But we’ll put a pin in that for now, and come back to it later.
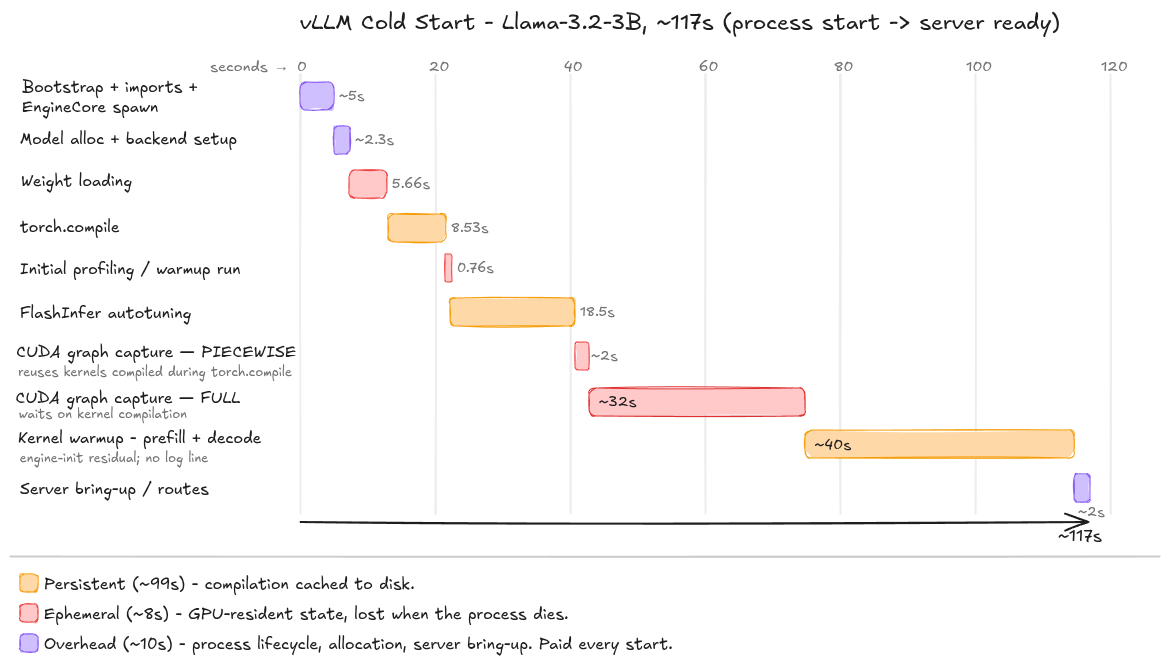
For now, we have our first metric: Weight loading (5.66s).
Is that good? Let’s check disk read speed (NVMe is our bottleneck).
sudo fio --name=max-read
  --filename=/dev/nvme0n1
  --rw=read
  --bs=1M # large blocks
  --iodepth=32 # saturates NVMe queue
  --direct=1 # bypass page cache (cold start!)
  --ioengine=libaio # enables async i/o to leverage queue depth
  --runtime=10
  --time_based
For my disk, this yields around 3764MB/s. Our weights are ~6GB; my theoretical minimum is 1.6s. Not great. Onwards.
Next, we need to initialise the KV cache. To determine how much room (VRAM) we can allocate to the KV cache, vLLM performs a dummy forward pass at the max_seq_len/max_num_batched_tokens, capturing the peak memory utilisation of the model – anything that remains is fair game for the KV cache.
We have a model and its weights loaded and ready to go; we also have initialised the KV cache so we can start playing with tokens. It might be sufficient to stop there if we were not working with a high-throughput and memory-efficient inference and serving engine for LLMs. Yes, we can run inference – no, it won’t be very fast. So how do we get there?
This is where vLLM starts to earn its keep. We’ll address each in turn:
- torch.compile
- FlashInfer
- Pre-emptive kernel compilation
- CUDA Graphs
torch.compile #
If you’ve spent any amount of time in deep learning codebases, you’ve probably come across torch.compile – you might not know what it is, but you’ve heard of it. You probably also know that Python is slow (relatively speaking). PyTorch’s eager execution mode has overhead on every operation: dispatch, type checking, kernel selection, argument validation, etc. – all of it runs on the CPU before a single kernel launches. torch.compile attacks this overhead, and is actually two things:
- Dynamo: a Python bytecode (
.pyc) interceptor. Instead of runningforward()normally, it intercepts it at the bytecode level and traces it into a graph representation of the operations. If it hits something it can’t break (like a function decorated with@triton.jit), it breaks the graph and falls back to eager execution for that segment. This is a good place to note that the heavy operations in vLLM (attention, matmuls, etc.) are handled outside of torch.compile; only the scaffolding between these is optimised. - Inductor: takes the graph built by Dynamo and compiles it into optimised code. Primarily, it uses operator fusion which leads to dispatch elimination; where eager mode may dispatch separate kernels for a linear layer, a bias addition, and an activation function (each with its own launch overhead and memory round-trip), Inductor fuses them into a single kernel and also generates Triton kernels (see below) for the fused ops.
Given the same configuration, torch.compile will always produce the same optimised kernels. vLLM exploits this by caching the output to ~/.cache/vllm/torch_compile_cache, keyed on a hash of the config.
This brings us to our next metric: torch.compile (8.53s).
FlashInfer #
Attention is the most expensive operation in the forward pass, and its cost profile looks nothing like training. At inference, we handle mixed batches – some sequences prefilling (processing prompt tokens in parallel; dense matrix-multiplies), others decoding (generating one token at a time; matrix-vector multiplies) – each with variable configurations (head dimensions, GQA ratios, datatypes, etc.). A general purpose attention kernel won’t cut it.
FlashInfer is an attention kernel library tailored specifically for inference workloads. It provides hand-tuned, pre-compiled attention kernels that covers the combinatorial space of inference attention. For any given configuration, there may be several valid kernel variants. FlashInfer uses an autotuner to benchmark the viable kernels against each other, and then stores the optimal tactic for each shape. Again, the results are cached to ~/.cache/flashinfer, and can be re-used with the same configuration.
This is a (relatively) time-consuming process, taking 18.5s in our experiment.
Pre-emptive Kernel Compilation #
It’s important to note that each time the model runs a forward pass, new kernels are (probably) compiled. Two things happen under the hood: functions decorated with @triton.jit are hit, and direct calls are made to library kernels (cuBLAS, cuDNN, etc.). The function of pre-emptive kernel compilation is to ensure that no unexpected compilation happens during live inference.
Compilation runs at a set of pre-defined shapes (e.g., seq_len=[1024, 2048, ...]) – a quick but important aside on what ‘shape’ means in this context: vLLM processes a batch of requests as a single 1-dimensional tensor; sequences are flattened end-to-end into one flat buffer, and attention masking ensures that each sequence only attends to itself. The dimension that varies, then, is the total token count in that flat buffer. At runtime an incoming batch is padded to the nearest one so that it can reuse the kernels already compiled for that size (e.g., a flat length of 1017 pads up to a compiled 1024).
Though compilation is interleaved throughout the startup process, it is broadly focussed in two distinct phases:
- Profiling runs: forward passes run across the range of pre-defined shapes, exercising the model’s main forward path (GEMMs, fused Triton kernels that Inductor generated, RMSNorm, RoPE, etc.). On each pass, when we hit
triton.jitor make a library call with a new shape, another kernel gets compiled. - Kernel warmup: happens at the very end. Profiling runs are not representative of deployment inference loads: they use placeholder metadata, where slot mappings are set to
-1so that KV writes hit an invalid slot and skip; empty attention metadata, and no sampling occurs. The kernel warmup stage runs the full execution path on representative prefill and decode workloads to hit the missed kernels: KV cache read/write kernels, sampling kernels, structured-output bitmask kernels, spec-dec kernels, etc. It’s the complement of the profiling runs, touching on everything they deliberately skipped. This stage measured ~40s in our experiment.
When a triton.jit function is hit, Triton compiles the source code in order through:
- Triton IR: thread-agnostic, operating purely in terms of blocks of elements.
- Triton GPU IR: introduces the GPU execution model, mapping from blocks of elements down to warps and threads.
- LLVM IR: Triton uses LLVM’s NVPTX backend, allowing Triton to leverage LLVM’s decades of compiler optimisations (loop optimisation, instruction selection, etc.).
- PTX: NVIDIA’s virtual ISA (instruction set architecture), architecture-agnostic.
Below, we can see an interactive visualisation of the interim stages a compilation of a Triton RMS Norm kernel, very handily produced by Claude.
The resulting PTX is cached keyed on a hash of the bytecode and specialisation constants (block size, etc.), and stored in ~/.triton. At runtime, the Triton-compiled PTX and the PTX of library kernels is compiled to SASS through the CUDA driver:
- SASS: NVIDIA’s equivalent of machine code; architecture-specific (will only work on the arch it has been compiled for) and microarchitecture-aware (can take advantage e.g. of Blackwell’s tensor cores).
Similarly, the SASS is cached too, keyed on the PTX hash and the SM version, and stored in ~/.nv/ComputeCache.
With potentially hundreds of unique compilations across a model, and with each PTX to SASS compilation being non-trivial, this amounts to a serious bottleneck. Worth paying upfront, because inference can now run at arbitrary shapes without unexpected compilations causing latency spikes. Moreover, it’s all cached for next time.
By now, we have complete (and compiled) sequences of kernels that are executed in the forward pass. And we can fairly comfortably assume that these sequences are fixed for their corresponding shapes. Now, remember what we said about launch overhead?
CUDA Graphs #
While torch.compile largely tackled launch overhead by reducing the number of kernels, CUDA graphs tackle what remains: the cost of issuing each surviving launch. Instead of the CPU walking the sequence and firing kernels one at a time – each requiring a separate trip across the CUDA API – the entire sequence is captured once and replayed as a single operation.
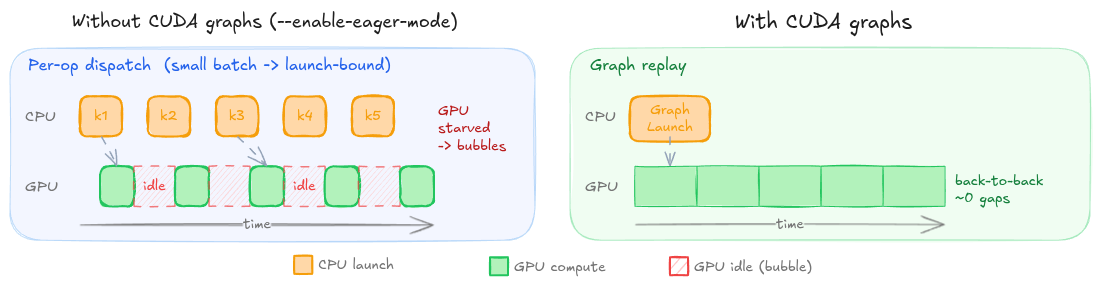
If you’re questioning ‘what if the GPU takes longer to complete than the CPU does to queue the next kernel?’, then you have touched on exactly why CUDA graphs are only captured for smaller sequences. Kernel launches are asynchronous: normally the CPU runs ahead of the GPU, keeping the stream’s pushbuffer full, but at smaller sequence sizes (e.g., seq_len < 512 tokens), each kernel runs for so little time that the GPU drains the queue faster than the CPU is able to refill it: the per-launch overhead is large relative to the compute time (launch-bound). If you were to visualise a trace of this execution, you might see something like the left-hand side of the image below: bubbles of idle time (bad) on the GPU between each kernel launch. For larger sequences, arithmetic intensity rises and per-kernel duration grows, so the fixed cost is amortised.
For smaller tensors, the forward pass is recorded at each capture size (e.g., seq_len=[32, 64, 128, 256, 512]). It is important to note that these shapes do not overlap with those encountered during the earlier profiling runs – as such, kernel compilation will occur for these smaller shapes. Each pass produces a static sequence (specifically a directed acyclic graph) of CUDA operations that can be replayed directly without the per-operation kernel dispatch overhead. At inference, incoming batches are padded and the corresponding graph replayed, almost entirely eliminating the CPU-side dispatch cost. The right-hand side of the below image illustrates this point.
Each node in the graph stores the kernel launch configuration and argument values – importantly, this also includes actual device addresses (pointers), meaning that if tensors are re-allocated to different addresses (such as on restart), the graph cannot be reused as the nodes point to stale addresses. This means that the graphs must be re-captured – though they can take advantage of the previously cached kernels – each and every startup.
This phase took a total of 34s (most of which is kernel compilation).
Summary: Cold Starts #
That’s everything done – we’re finally ready to start inference. We have:
- Our model loaded and ready on-device;
- fused operations, improving arithmetic intensity for loaded data, also reducing the number of dispatches (and associated overhead) required;
- selected the optimal attention kernel strategy;
- readied high-performance kernels for any shape a workload could throw at them;
- captured CUDA graphs to eliminate pipeline bubbles caused by dispatch overhead for smaller workloads.
vLLM has finally earned the ‘high-throughput and memory-efficient inference and serving engine for LLMs’ tagline. But it took a while – 117 seconds!
Here’s where the time went:
Now we’re finally ready to start whittling it down. Remember our container is ephemeral: any state accumulated during runtime is discarded when we shut the container down – unless we tell it not to.
Whittling it down #
The most obvious place to start (and this is going to land a bit cheaply) is to simply persist our cache folders on disk, and remount them into subsequent containers. This is achieved with a couple of Docker CLI args:
  -v ~/.cache/huggingface:/root/.cache/huggingface \  # Downloaded weights
  -v ~/.cache/vllm:/root/.cache/vllm \                # torch.compile cache
  -v ~/.triton:/root/.triton \                        # Compiled Triton kernels (PTX)
  -v ~/.cache/flashinfer:/root/.cache/flashinfer \    # FlashInfer strategy tables
  -v ~/.nv:/root/.nv \                                # Compiled kernels (SASS)
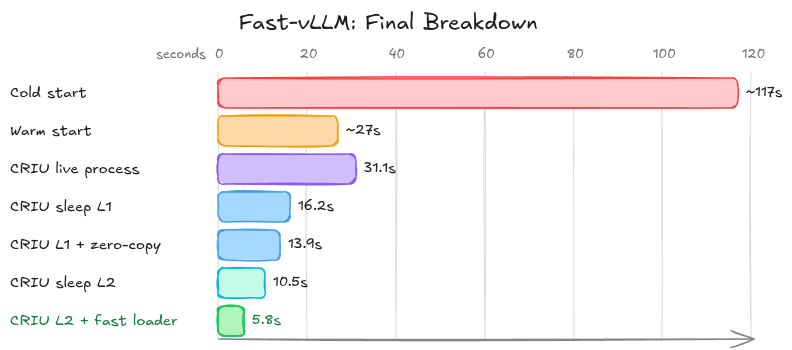
This is a pretty easy, if not satisfying, win. We’ve managed to knock 90 seconds off our start-up time, reducing from 117s to ~27s, just by re-using our caches.
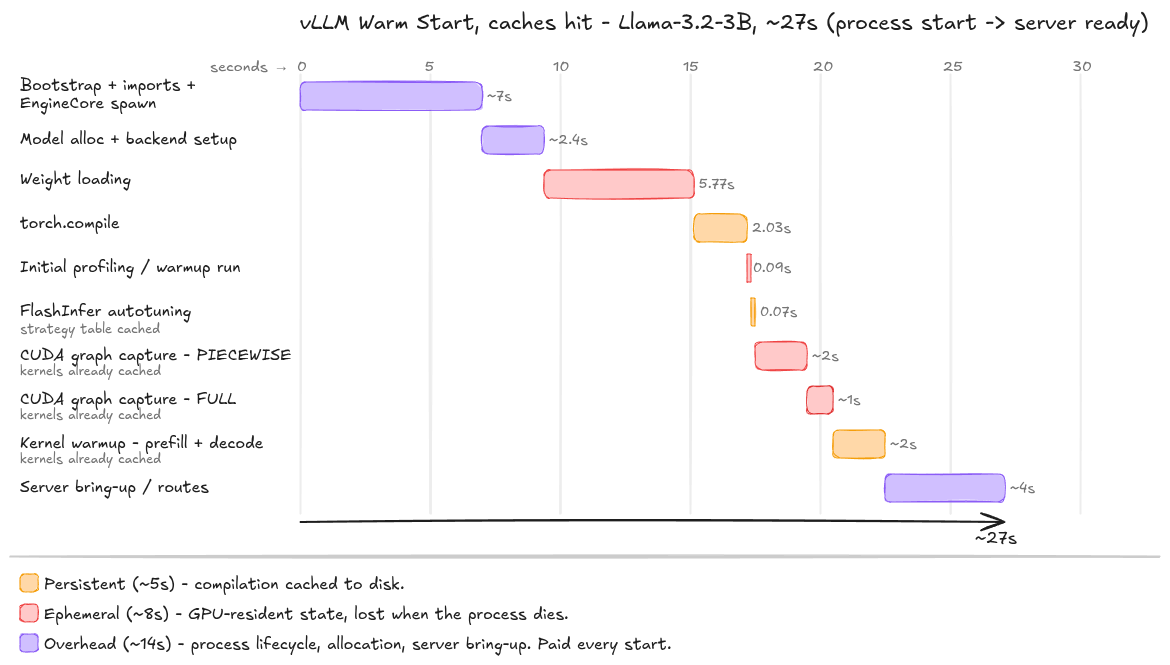
27 seconds is still a long time to wait. Notice that a big chunk of our time is largely overhead, and despite loading from cache, none of the stages have collapsed to zero time. So where do we go from here?
Firstly, I’d like to step back and take a quick detour. I’d like to discuss what vLLM actually is: a process.
The Process #
And what is a process? It’s essentially a state that exists across three locations:
- The process’s own memory: the address space. A set of virtual memory areas, each a range of addresses that have associated permissions (e.g., read, write, execute) and backing (e.g., anonymous, file-backed). It contains the code mapped from the running executable, the initialised data (think static and global vars – allocated once and persisted), the heap (grown on demand and carved up via
malloc; user-managed memory), a per-thread stack (local vars, current execution context, function args, etc.), and themmapregion where shared libraries (.sofiles, like Python runtime, libcuda, libtorch, etc.) are parked by the dynamic linker at startup. - The kernel, on the process’s behalf: the kernel maintains a
task_struct(one per thread) and associated structures that collectively describe everything that the process is to the OS:- Identity and lineage – PID (process ID), parent’s PID, process group, session ID, thread IDs.
- Per-thread execution context – the saved register set for each thread when it’s not scheduled (this is what gets restored on context switch)
- Open file table – a set of file descriptors, where each fd is a process-side handle into a kernel-side struct, which in turn points to a file, socket, pipe, etc. This covers things like stdin/stdout/stderr, sockets, device files, everything. Think of it as the kernel’s process I/O interface.
- Filesystem context – current working directory, root directory.
- Credentials and security – user and group IDs, and their associated capability sets (what privileged operations the process can perform).
- Namespaces and cgroups – which PID/mounts/network/etc. namespaces the process belongs to (what slice of the system the process can see), and its cgroup membership (which governs CPU, memory, and I/O limits). These two are together what makes a container a container: namespaces provides isolation from the host machine, while cgroups provide resource enforcement.
- A device and its driver: in our case, a GPU. This includes the device memory (VRAM allocations), loaded modules (compiled kernels/cubins), and the CUDA context – we’ll touch on this later.
So, what is a process? It’s the complete bundle of state tied to a thread group: its memory and the bytes in it, each thread’s execution context, its file-descriptor table and the live (OS) kernel objects behind each entry, its signals, credentials, and security context, its limits and scheduling state, its namespace and cgroup memberships, and its IPC objects – split across the process’s own memory and the kernel’s book-keeping, with, in our case, a slab of state out on the GPU besides. Let’s see how vLLM maps onto this model.
Imports #
Firstly, we’ll consider how a Python process is actually loaded. Once the Python interpreter has bootstrapped itself into existence (taking roughly 10-30ms), it begins to run the top-level functions of each module (.py file). The first thing we hit are imports. Let’s run through what happens when it reaches import torch:
sys.modules, an object containing every module built so far, is checked to see iftorchhas already been loaded (de-duplication); if it is, the existing object is passed and the interpreter skips.- If not, the interpreter walks the directories listed in
sys.path(heard of ‘on PATH’?) one by one; the first time it looks in a given directory, it caches the list of files. If the dir doesn’t containtorch, it errors, and moves on. - When found, the interpreter looks for a pre-compiled copy in
__pycache__. If the cache is a hit, it loads the bytecode from the.pycfile. If not, it compiles and writes a fresh.pyc. - The interpreter runs the top-level functions of the imported module; most contain more imports, and this process cascades again. Compiled extensions (
.so/.dlllibraries) are attached to the live process viadlopen(this is contrasted against the dynamic linker which performs a similar function at startup);dlopenfinds the library, thenmmaps the segments into the process’s address space and initialises them. Fortorch, this eventually pulls in the C++ core, and GPU libraries like cuBLAS or cuDNN. - As each submodule is scanned by the interpreter, the module object is completed in
sys.modules; thetorchmodule is fully built, and bound inmain.py’s namespace.
vLLM will pay the import cost once, at startup, and then forks the worker processes which inherited the imported state.
We can see where the time is spent performing import torch via a simple bash experiment using strace (Linux syscall tracer):
echo "import torch" > main.py
strace -c -f python3 main.py 2> strace_summary.txt
cat strace_summary.txt
# strace_summary.txt
% time     seconds  usecs/call     calls    errors syscall
------ ----------- ----------- --------- --------- -----------------------
97.62    1.070441       13054        82           futex
 1.07    0.011746           0     13504       687 newfstatat
 0.49    0.005413           2      2270       924 openat
 0.35    0.003861           1      2423           read
 0.08    0.000900           0      1302           mmap
 0.07    0.000748           0      2417           fstat
 0.07    0.000724           0       980           munmap
 0.05    0.000521           0      2167         3 lseek
 0.04    0.000471           0      1348           close
 0.04    0.000460           1       342           getdents64
 0.04    0.000459           0       781           brk
 0.03    0.000363           0      1102      1097 ioctl
...
------ ----------- ----------- --------- --------- -----------------------
100.00    1.096550          37     29079      2716 total
Just importing torch takes one second – doesn’t sound like much, but consider how many imports vLLM has. Ignoring the futex (mostly threads waiting on each other), we can see where the time goes:
- A lot of searching the disk:
newfstatat– fetch a file’s metadata by path (does it exist, if so what is it).openat– opening files. Note that when it tries to open a file that doesn’t exist it errors (time wasted! 924 times)read– copies bytes from file into memory.
- And some loading:
mmap– map a file/region into memory (this is the libraries being brought up).munmap– unmap.brk– grow the heap.
This import sequence produces in-memory state that belongs to the process: the module objects (like torch) live on the process’s heap, and the shared libraries (libcuda, libtorch, etc.) live in the mmap region. This state is rebuilt from scratch on every start, and is steady once built. The state we rebuild each time is essentially identical – we reuse the same recipe.
CUDA Context #
Once the imports (importantly torch) are loaded, we ask the CUDA driver to bring the device up. CUDA does this lazily, meaning it will not open up a CUDA context until the first call that requires the GPU.
CUDA context is essentially the GPU-side equivalent of a process’s address space. On the CPU side, a process has its own private memory map, loaded code, and open resources; a CUDA context is the per-process container holding the equivalents on device: GPU allocations, loaded kernels, and the channels that link the host to the hardware. The host manages the device through file descriptors to /dev/nvidiactl and /dev/nvidia*. All communication is performed through the ioctl syscall, which takes a file descriptor, a command code, and a payload, and leaves the interpretation to the driver. The NVIDIA driver defines its own command vocabulary, performing allocations, kernel launches, etc. encoded as ioctl calls. GPU memory allocated through this interface gets mapped into the host process’s virtual address space, appearing alongside the heap and mmap segments in /proc/<pid>/maps, and so the CPU is able to directly address it via ordinary pointers.
Every process that uses the GPU gets its own context per device – a live connection split across the process, the kernel driver, and the GPU, all keyed to the process. Therefore, it is ephemeral – and recreated at each startup.
Weights & KV Cache #
The full cost of initialisation is paid every startup. Weights are loaded and KV cache is allocated into device memory.
Cache Reuse #
We’ve just seen how we can re-use caches to eliminated the costs associated with compilation. However, not one of them eliminates the cost of having to load the result into a live process:
- Disk to host transfer: reading the cached cubins (NVIDIA), Inductor-generated
.sofiles, FlashInfer tactic tables. Each must be loaded from disk into memory. - Into the address space: the host-side compiled pieces (e.g., Inductor’s C++ wrapper) are
.sos, so they are loaded viadlopen: mapped in and initialised. - Into device and context: actual GPU code (like cached SASS) has to be loaded onto device and registered in the context through the driver’s module loading path.
Specifically:
- Triton
(~/.triton)+ SASS (~/.nv/ComputeCache): first hit of atriton.jitkernel at warmup finds the cached artefact and skips the compile, but still has to load the module into the context and set up the Python-side launcher. Metadata on the heap, kernels in device memory. - torch.compile: cache hit skips the Inductor codegen and the C++ compile, but we still have to deserialise the artefacts,
dlopenthe generated wrapper, wire it back into the forward pass, and load the Inductor-generated Triton kernels (see above). Metadata on the heap, kernels in device memory, and.sos in themmapregion. - FlashInfer: tactic-table lookup. The selected kernels still have to be loaded into the context. Metadata on the heap, kernels in device memory.
This can mean loading hundreds of files. While each may be small, the cost of making many small calls with fixed overhead, serially, adds up. Again, we’re paying this cost every time.
OS Kernel State #
The OS kernel maintains book-keeping about the running threads via the task_struct and the kernel objects that are attached to it. The vLLM process is essentially a bundle of many threads, each performing different tasks: asynchronous event loops, threads servicing ZMQ channels, the engine, the workers, etc.
The kernel holds an execution context for each thread. When a thread isn’t scheduled, the kernel holds a snapshot that is required to restore it exactly to its previous state. That includes general purpose registers, the instruction pointer (where the thread resumes), the stack and base pointers (where its memory lives), and more.
It also holds an open file table. This is where most of the live state lives:
- stdio
- GPU connection – file descriptors (fds) to
/dev/nvidiactl,/dev/nvidia*, etc. These are the kernel-side handles that link userspace to the device. Everyioctlto the driver goes through them. - IPC – vLLM communicates between the API server, engine, and the workers with ZMQ over
ipc://(Unix domain sockets). These sockets are fds. - Listening socket – the API server’s bound socket (usually
:8000)
It also maintains records on the process tree, with its PIDs, parent PIDs, process group and session; current working directory and root; user ID and capabilities; and namespace and cgroup memberships.
Each startup, we have the same threads doing the same jobs, the same fds pointing at the same objects. Recreated from scratch every time.
Summary #
Let’s pause and consider what we have:
- Address space: the interpreter bootstraps itself into existence, the imports populate the heap with module objects and map the libraries into the
mmapregion, and CUDA context init attaches the device context via/dev/nvidia*descriptors. Same imports, same libraries, same context, every time. - Device memory: weights in VRAM, KV cache reserved, compiled kernel modules loaded and registered in the context. Same weights, same kernels, every time.
- Kernel state: the thread group and its register sets, the process tree, and the fd table. Same content every time.
Taken together, each and every time, we’re paying a high cost to initialise the exact same process, illustrated below:
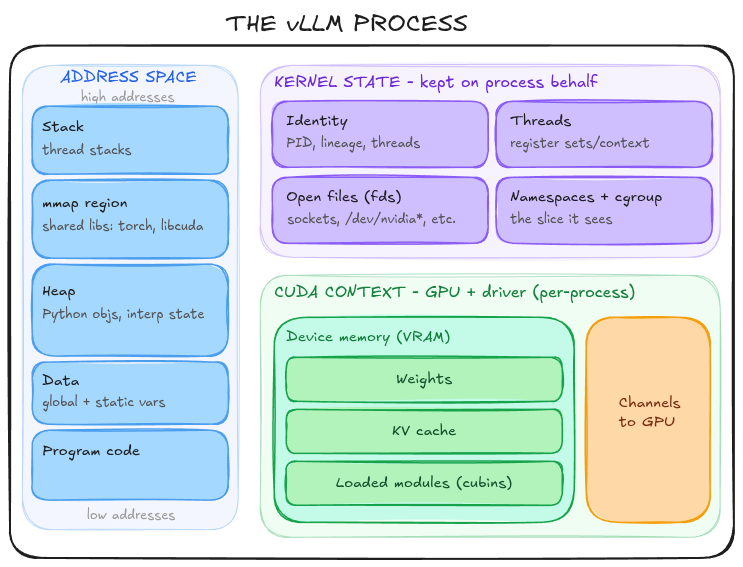
If only there were a way to somehow checkpoint this process state and restore it exactly as it was …
Checkpoint-restore in userspace. The hero we need. It allows us to restore our process to exactly the same state it was when it was captured – importantly, that allows us to sidestep the startup tax discussed in the previous section, swapping it out instead for restore time. CRIU freezes a running process, captures its entire address space, device descriptors, threads, register sets, process tree, and file descriptor table, and serialises it to a set of image files on disk. Later, it reads those images back and reconstructs the process so it resumes exactly where it left off, as though it had never stopped.
Magic? No …
Checkpoint #
CRIU works by firstly seizing control of the process via ptrace: a syscall enabling one process, the tracer, to observe and control the execution of another process, the tracee. It does this by attaching to the target’s PID, putting the target into a stopped state, and then changing its parent PID in the kernel’s task_struct. Then, the tracer can examine and modify the CPU’s registers.
Let’s walk through the dump phase:
- Freeze the tree: use
ptraceto seize and interrupt the process, to stop it changing state mid-dump. It also enumerates over the children and threads from/proc/<pid>/task. - Collect the externally visible state: CRIU reads what the kernel exposes:
/proc/<pid>/mapsandsmapsgive the VMA layout./proc/<pid>/map_files/links each file-backed region to its actual file./proc/<pid>/pagemapsays which pages are present, swapped, or file-backed./proc/<pid>/fd/andfdinfo/give the file descriptors with their offsets and internal state (if applicable).status/statgive credentials and lineage./proc/<pid>/ns/gives namespaces.ptrace(PTRACE_GETREGSET)reads the registers per thread.
- Parasite injection: some state can only be obtained by running code as the target, such as dumping memory, or per-process syscalls that must execute in-context. CRIU solves this in a clever manner – recall that we said ’the tracer can examine and modify the CPU’s registers’; CRIU overwrites the contents of some CPU registers via
PTRACE_SETREGto issue anmmapsyscall. Once it has allocated memory for itself, it writes a small compiled parasite blob (a standalone.owith nolibcdependency – we don’t want to pollute the target process’s address space with a second libc – the target already has its own mapped, with its own state, and a second copy could corrupt it) into that region. This code appears, to the OS kernel, part of the process. CRIU then sets up a Unix domain socket pair – one fd in CRIU’s namespace, one injected into the target (think client/server relationship). This becomes the command channel: CRIU sends commands, and the parasite executes them inside the process and returns the results using a shared memory region that is mapped for bulk data transfer. CRIU sends commands like:PARASITE_CMD_DUMPPAGESwalk the process’s memory and dump pagesPARASITE_CMD_DUMP_SIGACTSread signal handler tablePARASITE_CMD_DRAIN_FDSpass open file descriptors back over the socketPARASITE_CMD_GET_PROC_FDget a handle to/proc/self/
- Selectively dump memory: using the pagemap (
/proc/<pid>/pagemap), CRIU writes only what can’t be regenerated: anonymous and modified private pages have their bytes written to the pages image; clean file-backed pages are not stored, just recorded (i.e., ’re-map file X at offset Y’). - Write images and detach: everything is serialised to a set of protobuf image files: per-thread execution context, memory map, pagemaps and pages, descriptors, credentials, etc., are all stored. Finally, CRIU either restores the original process and detaches, or kills the process.
Note that the GPU is entirely invisible to CRIU. GPU state is stored across the device memory and driver, neither of which are reachable by CRIU. cuda-checkpoint bridges the two by reshaping the GPU state into something that CRIU can see. Before a checkpoint, it copies device memory back to the host and releases the GPU resources so the process holds no live device state. At this point, the VRAM contents are just anonymous host pages that CRIU dumps normally.
Restore #
The restore phase is quite interesting: CRIU restore is, itself, a process with its own address space, and has to gradually morph into the target, until it has the same PID, same memory, same registers, and same execution state as it did when the process was captured.
Restore broadly happens in two phases. Phase 1:
- Recreate the tree with the correct identities: CRIU forks the task tree, and each task must get its original PID. On modern kernels, this is achieved via
clone2(), which is similar tofork()but with more precise control over execution context – important, because it allows us toset_tid()to select specific PIDs for the processes. This is why CRIU is a good match for containers – they operate within a private namespace, and so we can useset_tid()cleanly; on the host’s global PID namespace, we’d have to contend with everything else on the machine for the original PID, as they are recycled after use. - Each task rebuilds its own resources: by running CRIU’s restore code, each task reopens its files (and seeks to the saved offsets), recreates pipes and sockets, and reconnects the ones shared within the tree. Established TCP is rebuilt using the kernel’s repair mode. This step proceeds via syscalls to restore state:
- Filesystem context (
chdirfor cwd,chrootfor root,umaskfor umask) - Credentials (
setresuid/setresgidfor uid/gid sets,setgroupsfor supplementary groups,capsetfor capabilities), - Signal dispositions (
rt_sigactionper signal to re-install each handler,rt_sigprocmaskfor blocked mask,sigaltstackfor alternate stack, pending signals re-queued viart_sigqueueinfo/tgkill) - Timers (
setitimer)
- Filesystem context (
That was the easy part. Now for the hard part. Remember we said that CRIU has to morph into the target process? To do that we have to eliminate every trace of CRIU: the address space has to hold the target’s memory at the target’s addresses – CRIU’s code, state, and heap currently occupy this space. That’s hard to do when the routine carrying out this replacement is running from CRIU’s code, on CRIU’s stack, in CRIU’s address space. We’re trying to remove the floor while we’re standing on it. We have to unmap the mappings we’re currently executing from, and free the stack we’re currently using. Even once the memory is the target’s, we have to load the whole register set and resume at the frozen instruction – but the instructions that perform this operation need registers and a stack of their own. Once again, CRIU has a clever answer:
Map: CRIU maps a small chunk of code (
pie= position independent executable; entrypoint) that makes raw syscalls directly, running on its own tiny stack carved out of its own region, placed, together with the data it needs to restore (target VMAs, page contents, register sets), at an address chosen specifically so that none of the target’s mappings will land on top of it. CRIU then jumps to the small chunk of code and executes.Switch off the old stack: it stops using its original stack, moving the stack point to the blob’s own stack, and then unmaps the original.
Demolish: the code walks the address space and unmaps everything that isn’t itself or its data. The original CRIU restore code, the old stack, heap, libc, etc, all are unmapped. Only the blob remains in the address space.
Rebuild at the original addresses: for each of the target virtual memory addresses, the code performs an
mmapwithMAP_FIXED(forces each region to the address it lived at previously) at the exact original virtual address, with the original permissions and backing (anonymous/file backed). This means that every pointer survives restore – heap pointers, function pointers, device pointers, CUDA graphs, etc. – all valid because the memory was laid back down at the exact same place.Fill: anonymous pages have their saved bytes copied in from the image (clean file-backed pages are already correct, so they’re skipped). This is done sequentially via
preadv– a vectored positional read (pread) that pulls saved bytes from the image file’s descriptor into the freshly mapped pages. The cost of this is a mandatory double copy: by the timepreadvruns, the image data exists in the kernel’s page cache from when CRIU read the image file off disk;preadvmust then pull the relevant bytes from the page cache and copy them into the anonymous page, before punching a hole in the image file after each read to release the page cache copy. We’ll re-visit this, because it’s slower than we can do for our use-case: every page is copied up-front at restore time, whether or not the process ever touches it. Since we’re optimising for start-up latency, that’s sub-optimal – a copy-on-write (only copy the page if it’s dirtied/its state is modified) backed mapping would defer the copy to runtime and pay it only on the pages that are actually written, leaving immutable code and other untouched pages at zero cost. Anyway – after restoring the address space, the restorer tears itself down, unmapping its working memory, leaving only one small blob.Restore CPU state: at this point, we need to restore the CPU state. A bit of a sticky one, since we’d like to use the CPU to restore it. To restore state, we’d need to overwrite the registers with the saved values, and then jump to the saved instruction pointer. But we have a quandary:
- The moment we load the stack pointer with the target’s value, our own stack is gone – this is where the restore code keeps local variables.
- The moment we load the instruction pointer, execution leaves our restore code, so we cannot make any further moves.
Ideally, we’d swap the entire CPU state and jump in one move. Thankfully, the OS has this exact capability, built for signals. A signal is the OS interrupting a running thread to deliver a notification – you’ve seen this if you’ve ever
SIGINT’d a process withCTRL + C. The OS pauses a thread, runs a handler function to completion, and then resumes the thread exactly where it was interrupted. To do this, it first saves the thread’s entire CPU state (every register, stack pointer, instruction pointer, etc.) into a block of memory it pushes onto the thread’s stack. This block is called a signal frame. When the handler is finished, it fires thert_sigreturnsyscall, which takes the signal frame from the stack and atomically reloads the CPU state from it, resuming execution at the exact state it left off. CRIU leverages this by writing a block into the thread’s (now restored) stack which is laid out like a real signal frame, but filled with checkpointed values. Then it callsrt_sigreturn.
Et voilà – process restored.
Restoring vLLM #
Each experiment, we’ll time how long it takes for the vLLM process to be restored, how long it takes to reload the weights (where appropriate), and the time for the first token (TTFT).
CRIU is remarkably fiddly and tempermental. To keep it happy, we must first set a number of container and CRIU flags. To see these, expand the section below.
Flags and vars
Container flags:
--cap-add=SYS_ADMIN \
--cap-add=SYS_PTRACE \
--cap-add=SYS_TIME \
--cap-add=SYS_RESOURCE \
--cap-add=CHECKPOINT_RESTORE \
--cap-add=NET_ADMIN \
--cap-add=DAC_READ_SEARCH \
--security-opt seccomp=unconfined \
--security-opt apparmor=unconfined \
-e VLLM_SERVER_DEV_MODE=1 \
-e OMP_NUM_THREADS=1 \
-e MKL_NUM_THREADS=1 \
-e TORCH_NUM_THREADS=1 \
-e TOKENIZERS_PARALLELISM=false \
-e CUDA_DEVICE_MAX_CONNECTIONS=1 \
SYS_ADMINandCHECKPOINT_RESTORErequired for parasite injection, namespace manipulation, etc., that is forbidden by the default container sandbox.SYS_PTRACEenablesptraceusage.SYS_TIMEadded due totimens.c:101: Unable to set a monotonic clock offset: Operation not permitted, CRIU restores the namespace’s monotonic offset so needs this capability to do it.SYS_RESOURCENET_ADMINTCP socket repair.DAC_READ_SEARCHlets CRIU bypass file read/path permission checks when restoring open fds.seccomp=unconfined, apparmor=unconfinedsome syscalls required by CRIU are blocked, these unblock them.VLLM_SERVER_DEV_MODE=1required to enable sleep mode.OMP_NUM_THREADS=1,MKL_NUM_THREADS=1,TORCH_NUM_THREADS=1,TOKENIZERS_PARALLELISM=false. EngineCore was spawning 70+ threads and CRIU’s parasite restorer kept segfaulting during the memory remap of the process. Pinning thread counts dropped this to just over 40 and restore started succeeding.
CRIU flags:
--tcp-established \
--shell-job \
--ext-unix-sk \
--skip-in-flight \
--link-remap \
--allow-uprobes \
--enable-external-masters \
--tcp-establishedcheckpoint live TCP connections.--shell-jobvLLM’s original parent (docker-init/the shell) won’t exist at restore, so CRIU has to tolerate the pid/session mismatch.--ext-unix-skallows dumping unix domain sockets whose peer lives outside of the process tree.--link-remaphandles files that are unreachable by their original path at restore (e.g., temp files).--skip-in-flightskip in-flight TCP data so a half-sent buffer doesn’t error the dump.--allow-uprobesavoids faults when encountering tracers.--enable-external-mastersavoids faults when the process is attached to something outside of the process tree (i.e., Docker).
Necessary also to stop the charming Unknown shit 600: (IO_URING) CRIU error:
sudo sysctl kernel.io_uring_disabled=2
Checkpoint-restore of the vLLM Process #
Firstly, we’ll capture and restore the live vLLM process when it has finished initialisation and is ready to start generating tokens. cuda-checkpoint moves the GPU state to memory, and the full process is dumped; weights are baked into the model checkpoint.
Surprisingly, this process was actually slower than simply relaunching the process with warm caches. I’d hypothesise that this is due to cuda-checkpoint having to recreate GPU state (~12GB) through a sub-optimal path. Maybe we should see what happens if we handle restoring GPU state ourselves?
Checkpoint-restore at Sleep Level 1 #
vLLM has a sleep mode feature that allows us to offload the GPU state, discarding KV cache and storing the model weights in host memory. This is perfect, as it means that cuda-checkpoint will only have to restore the CUDA context on-device.
curl -s -X POST 'http://localhost:8000/sleep?level=1
When we hit the sleep endpoint, a remote procedure call (RPC) is dispatched to all of the workers, and their sleep function is called. vLLM uses a CUDA memory allocator to manage memory allocations (parameters, KV cache, etc.). When we put vLLM to sleep, the allocator iterates over all of the allocations it has made on the GPU, making a pinned copy in host memory for those we wish to later restore, and then unmaps and releases the allocations on-device. However, it will maintain a record of what these allocations were and where they were made (by address). At sleep level 1, only the weights are backed up to CPU; the KV cache is discarded entirely. We checkpoint at this stage, when vLLM is asleep. This reduces our checkpoint size to 11.4GB, and, importantly, cuda-checkpoint does not have a bulky GPU state to restore. CRIU will restore the state exactly as we captured it, with weights in host memory.
Thankfully, when we wake vLLM back up, the allocator automatically creates new physical allocations and maps them back to original virtual address. The backed-up CPU tensors (weights) are then restored to device via cudaMemcpy – although a serialised operation, this weight reload takes just ~2.3s because the tensors are resident in pinned host memory and so are able to take full advantage of the DMA to device.
We can also whittle down the time it takes to restore the vLLM process to a live state. Remember how we discussed earlier how preadv was sub-optimal for our CRIU use-case (all pages copied up front), and how we’d benefit from instead using a copy-on-write backed mapping (only copy pages if they’re dirtied)? Thankfully, Doubleword’s CRIU fork does just that: it replaces the native preadv path with a zero-copy mmap path; perfect, given the vLLM state is largely stable (requiring fewer page writes) after initialisation. Re-running our sleep level 1 experiment using this fork reduced restore time by ~2s.
Not bad – but not great. In similar spirit as the leap from the last section – alleviating the burden on slower, more generic restore paths (last time it was cuda-checkpoint; we gave its work to vLLM) – we can go one step further and reduce the amount of work CRIU restore has to do.
Checkpoint-restore at Sleep Level 2 #
vLLM also has a second sleep level. At this level, vLLM’s GPU allocations, including weights and KV cache, are discarded entirely (though the allocator still maintains its pointers and named buffers, such as RoPE scaling tensors, are maintained and saved to host). This means that when we checkpoint the sleeping process, the weights are not baked into the checkpoint. In so doing, we manage to reduce our checkpoint size to just 3.4GB – this restores in a blazingly fast 2.5s.
On wake-up, the allocator again re-creates the virtual addresses with physical memory backing – but we don’t have any backup CPU tensors. Instead, we have to hit vLLM’s collective_rpc endpoint to issue a reload_weights call to the workers:
curl -s -X POST 'http://localhost:8000/collective_rpc' -H 'Content-Type: application/json' -d '{"method":"reload_weights"}'
This weight reload functions in much the same way to the initial weight load – amounting to an iterator calling copy_. Weight reload completes in ~8s, giving us a TTFT of 10.5s.
We can do much better than vLLM’s native reload path – to do so, we’ll have to implement our own weight-loading logic on a fork of vLLM.
The safetensors file we loaded our weights from initially acts as a source file; during startup, vLLM transforms these weights, with each layer and quantisation method performing their own manipulations, for example to reorder them for better memory access, quantise them, fuse them into buffers (q/k/v -> qkv), etc. By the time startup finishes, the tensors sitting on the GPU have different names, shapes, and layouts from anything on disk. We want to capture this state, rather than pay the cost of processing them again.
First, we serialise the weights to a flat file before sleeping by walking model.named_parameters(), appending raw bytes to a .bin file and building an index of (offset, length, shape, dtype) as we go. The resulting file is essentially a single contiguous blob of every parameter back to back, together with an index file that says “tensor name lives at byte offset, runs for length bytes, and should be interpreted as shape/dtype” – just what we need to restore them. Now, our goal is to get these parameters on-device and at their address as fast as possible.
Let’s run through some options:
- Baseline per-tensor
copy_: we iterate over each tensor (using the index file), andcopy_each parameter individually into its destination – same effect as vLLM’s default weight loader; serialised per tensor, fixed overhead per transfer. Bad. - Coalesce the transfer: read the whole weights file into memory, then copy the whole weights file to a staging buffer on device (host-to-device; H2D) – in one transfer. Once the weights are resident in buffer, we can perform a device→device
copy_to move the tensors to the correct device address – fast. Requires us to pin a very large allocation in memory. PCIe (memory → device) sits idle while the weights file reads into memory, NVMe (disk → memory) sits idle while it’s copied to device. Bad. - Chunk the transfer: split the weights file into chunks. Maintain two separate buffers, and read chunk $N+1$ into one while copying chunk $N$ from another, using two separate threads and switching the role of each buffer after each transfer. H2D/D→D overlaps with memory read, and we need only need to pin enough memory for the two buffers. Good. However, we only have one
preadvin flight at once, yielding a queue depth of 1 on NVMe, failing to saturate bandwidth (I measured ~700mb/s at QD1, versus measured 3764mb/s theoretical max). Bad. - Saturate the disk: split the chunks into $N$ slices, and have a separate thread move each slice from disk to memory. This yields multiple
preadvin flight at once, building queue depth and saturating the disk’s channels. Good (empirically, $N=8$ offered me the best results).
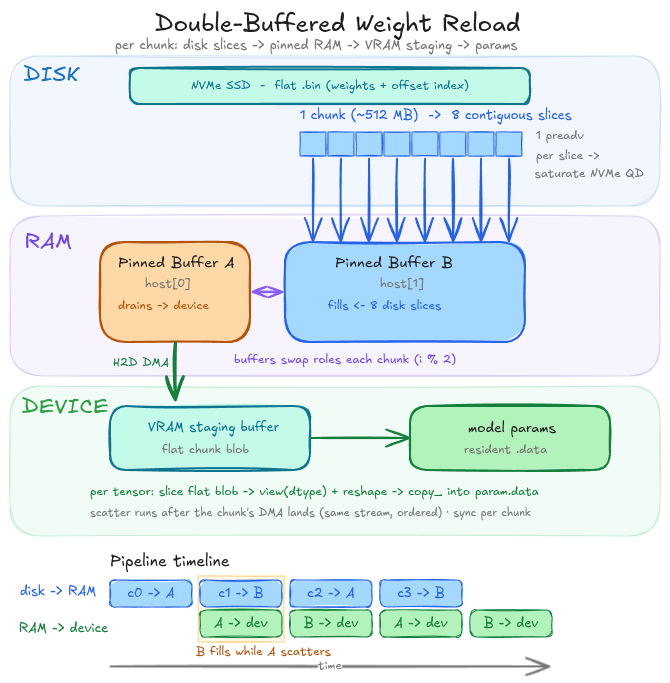
Thus, we arrive at reload_weights_fast: we group the parameters into chunks, create two pinned buffers in CPU memory, spin up $N$ threads to each grab a slice of the chunk then start loading the slices into one buffer. Once the chunk is in memory, it is DMA’d onto device, where it is reinterpreted into distinct tensors and copy_’d into its destination; meanwhile, the other buffer is being filled from disk. Rinse and repeat until all weights have been restored. Using $N=8$ and a chunk size of 512mb, this process reduced weight reloading to a blistering 3.3s (versus a theoretical minimum of ~2s).
And so, we arrive at the end (for now). We have reduced the time it takes to cold-start a vLLM container by a factor of 20, from 117 seconds to just 5.8 seconds.